
State of School Lunches: What Parents Are Packing, Paying & Prioritizing
Packing for school lunches is part planning, part parenting, and part peacekeeping.
From picky palates to lunchbox fatigue, sending kids off with a satisfying school meal has become a daily balancing act. Now that the school year is officially underway, many parents are once again navigating the highs and lows of lunchtime prep, juggling nutrition, convenience, and what their child will actually eat.
In our newest survey of U.S. parents with school-aged kids, we dug into the real-world lunch rituals, including budgeting, packing patterns, guilt-driven food swaps, and pizza’s enduring popularity.
Key Highlights:
- Prevalence of Packed Lunches: 75% of parents pack lunch for their child at least once per week.
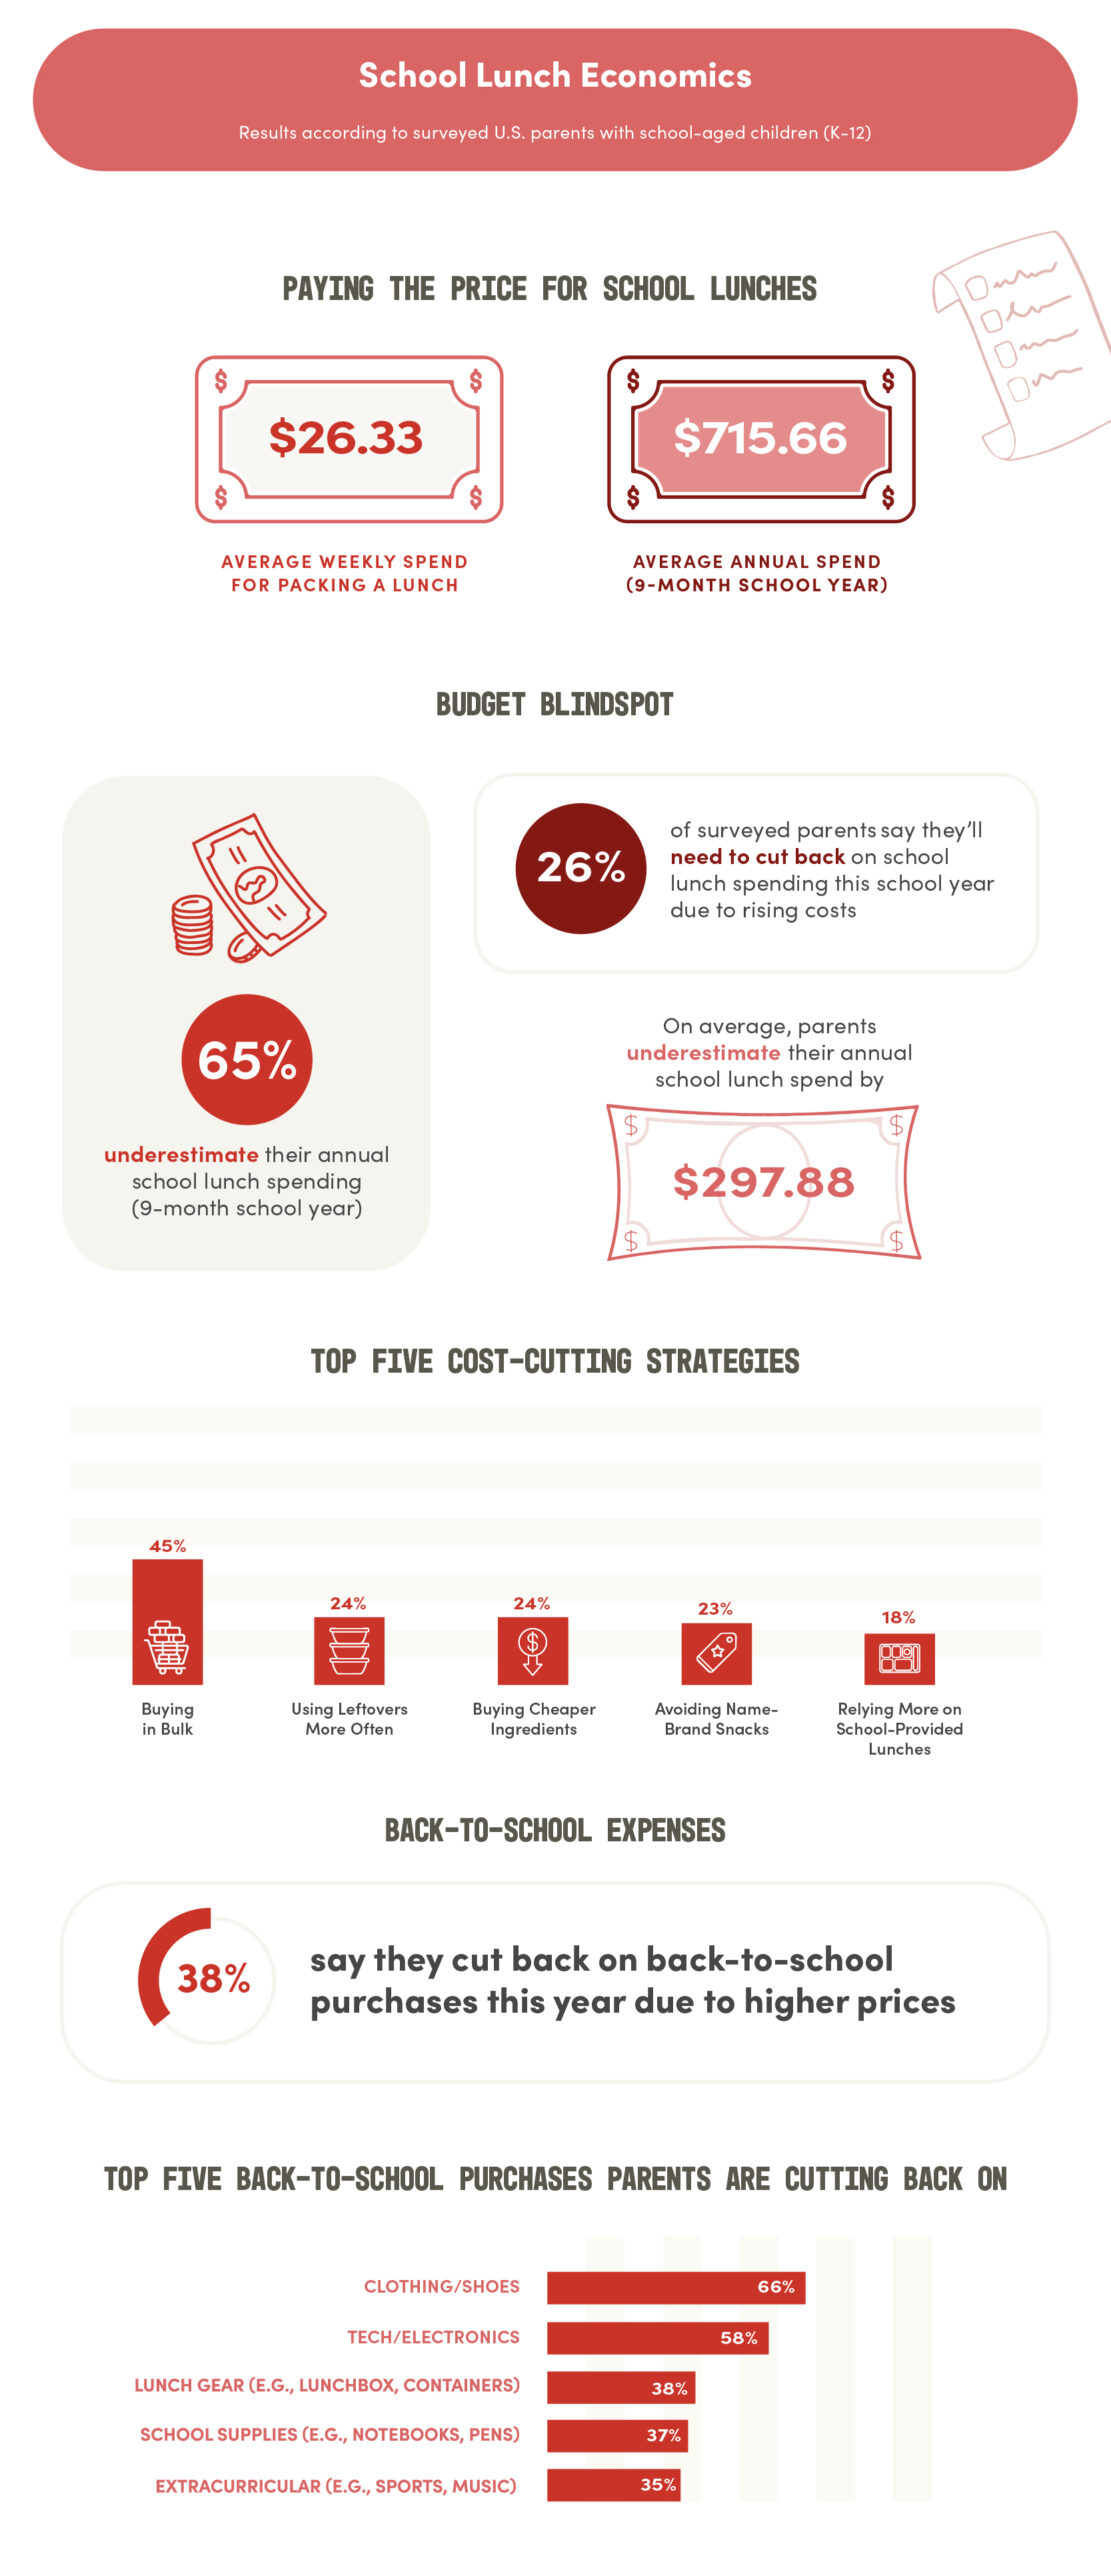
- Budget Breakdown: Parents estimate they spend about $715 per year on school lunches, but 65% underestimate their total costs by nearly $300 on average.
- A Preference for Pizza: 62% of parents say their kid has asked for pizza in lunchboxes, and 7 in 10 parents say it can be healthy but only if it’s made right.
- Picky and Pressured: 85% of parents describe their child as “somewhat picky” or “very picky,” and 60% admit they feel pressured to pack unhealthy items.
- Lunchbox Burnout: 43% of parents report getting fatigued from lunch prep, and nearly 1 in 4 (23%) have forgotten to pack a lunch due to stress.
How Parents Pack School Lunches in 2025
For many families, lunch prep is not only a weekday ritual, but also a negotiation. Our survey found that over a quarter of parents (27%) pack lunch every day, while nearly half (48%) alternate between packing lunch and relying on school-provided meals.
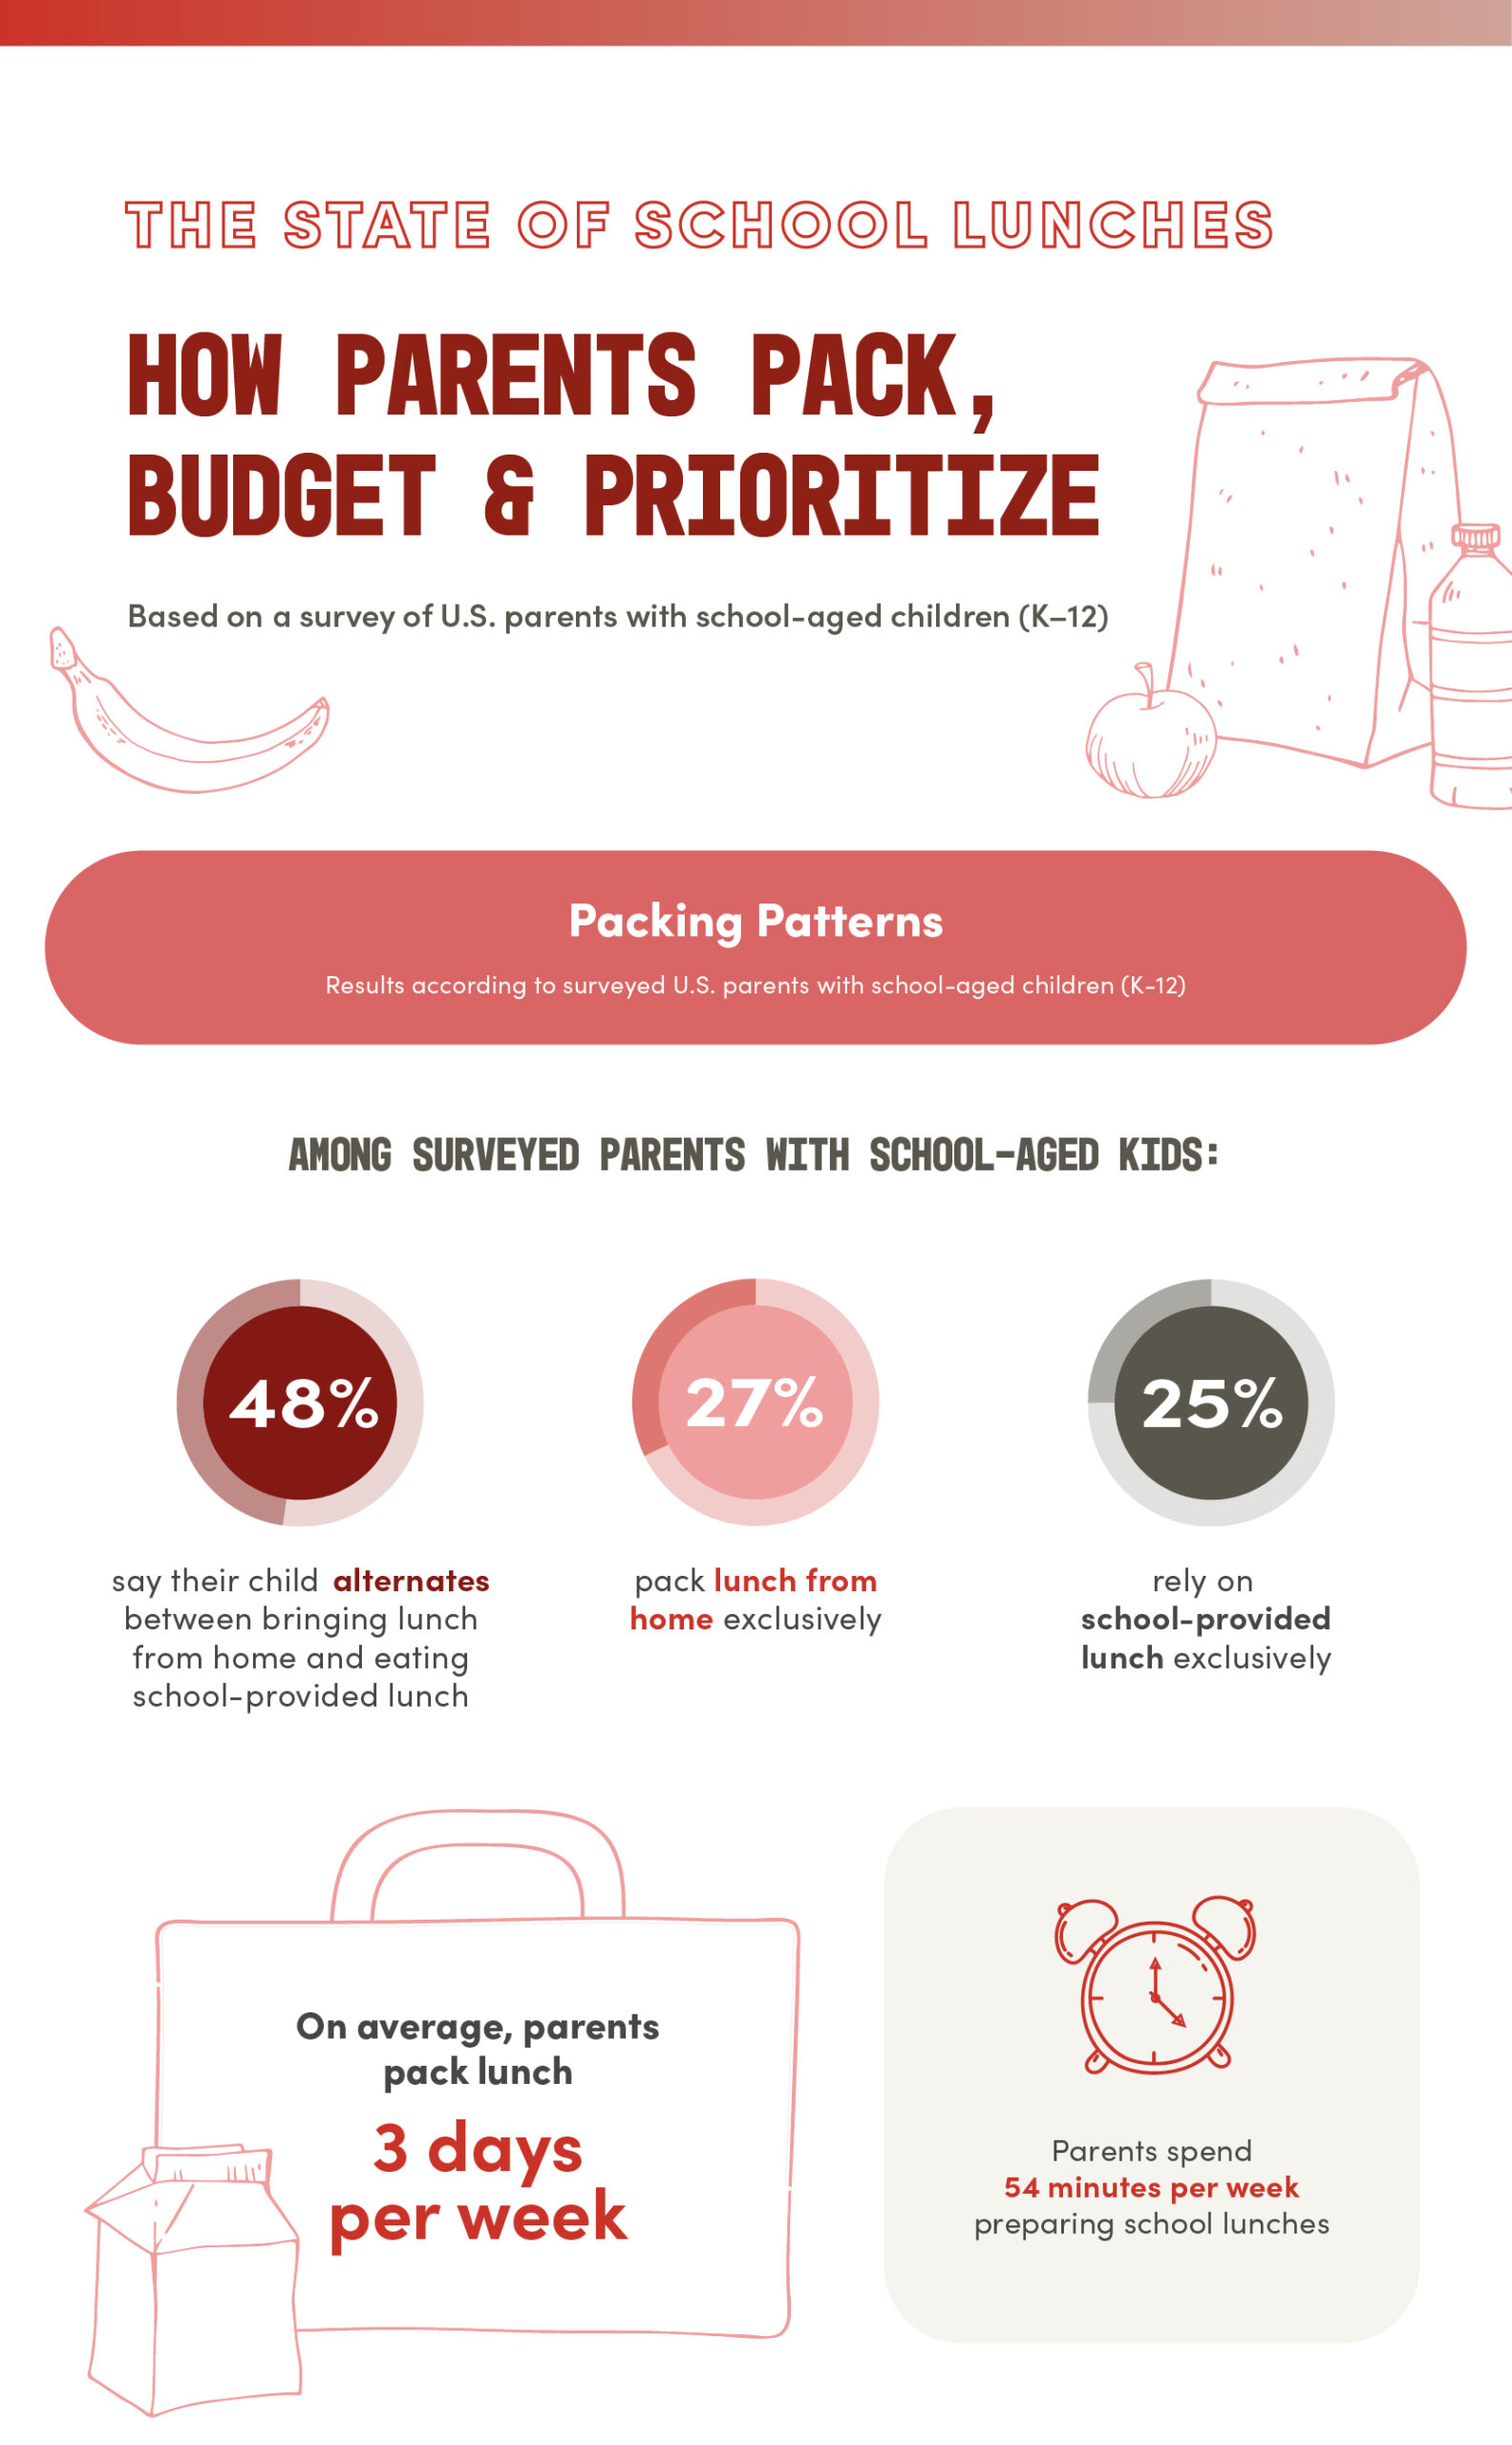
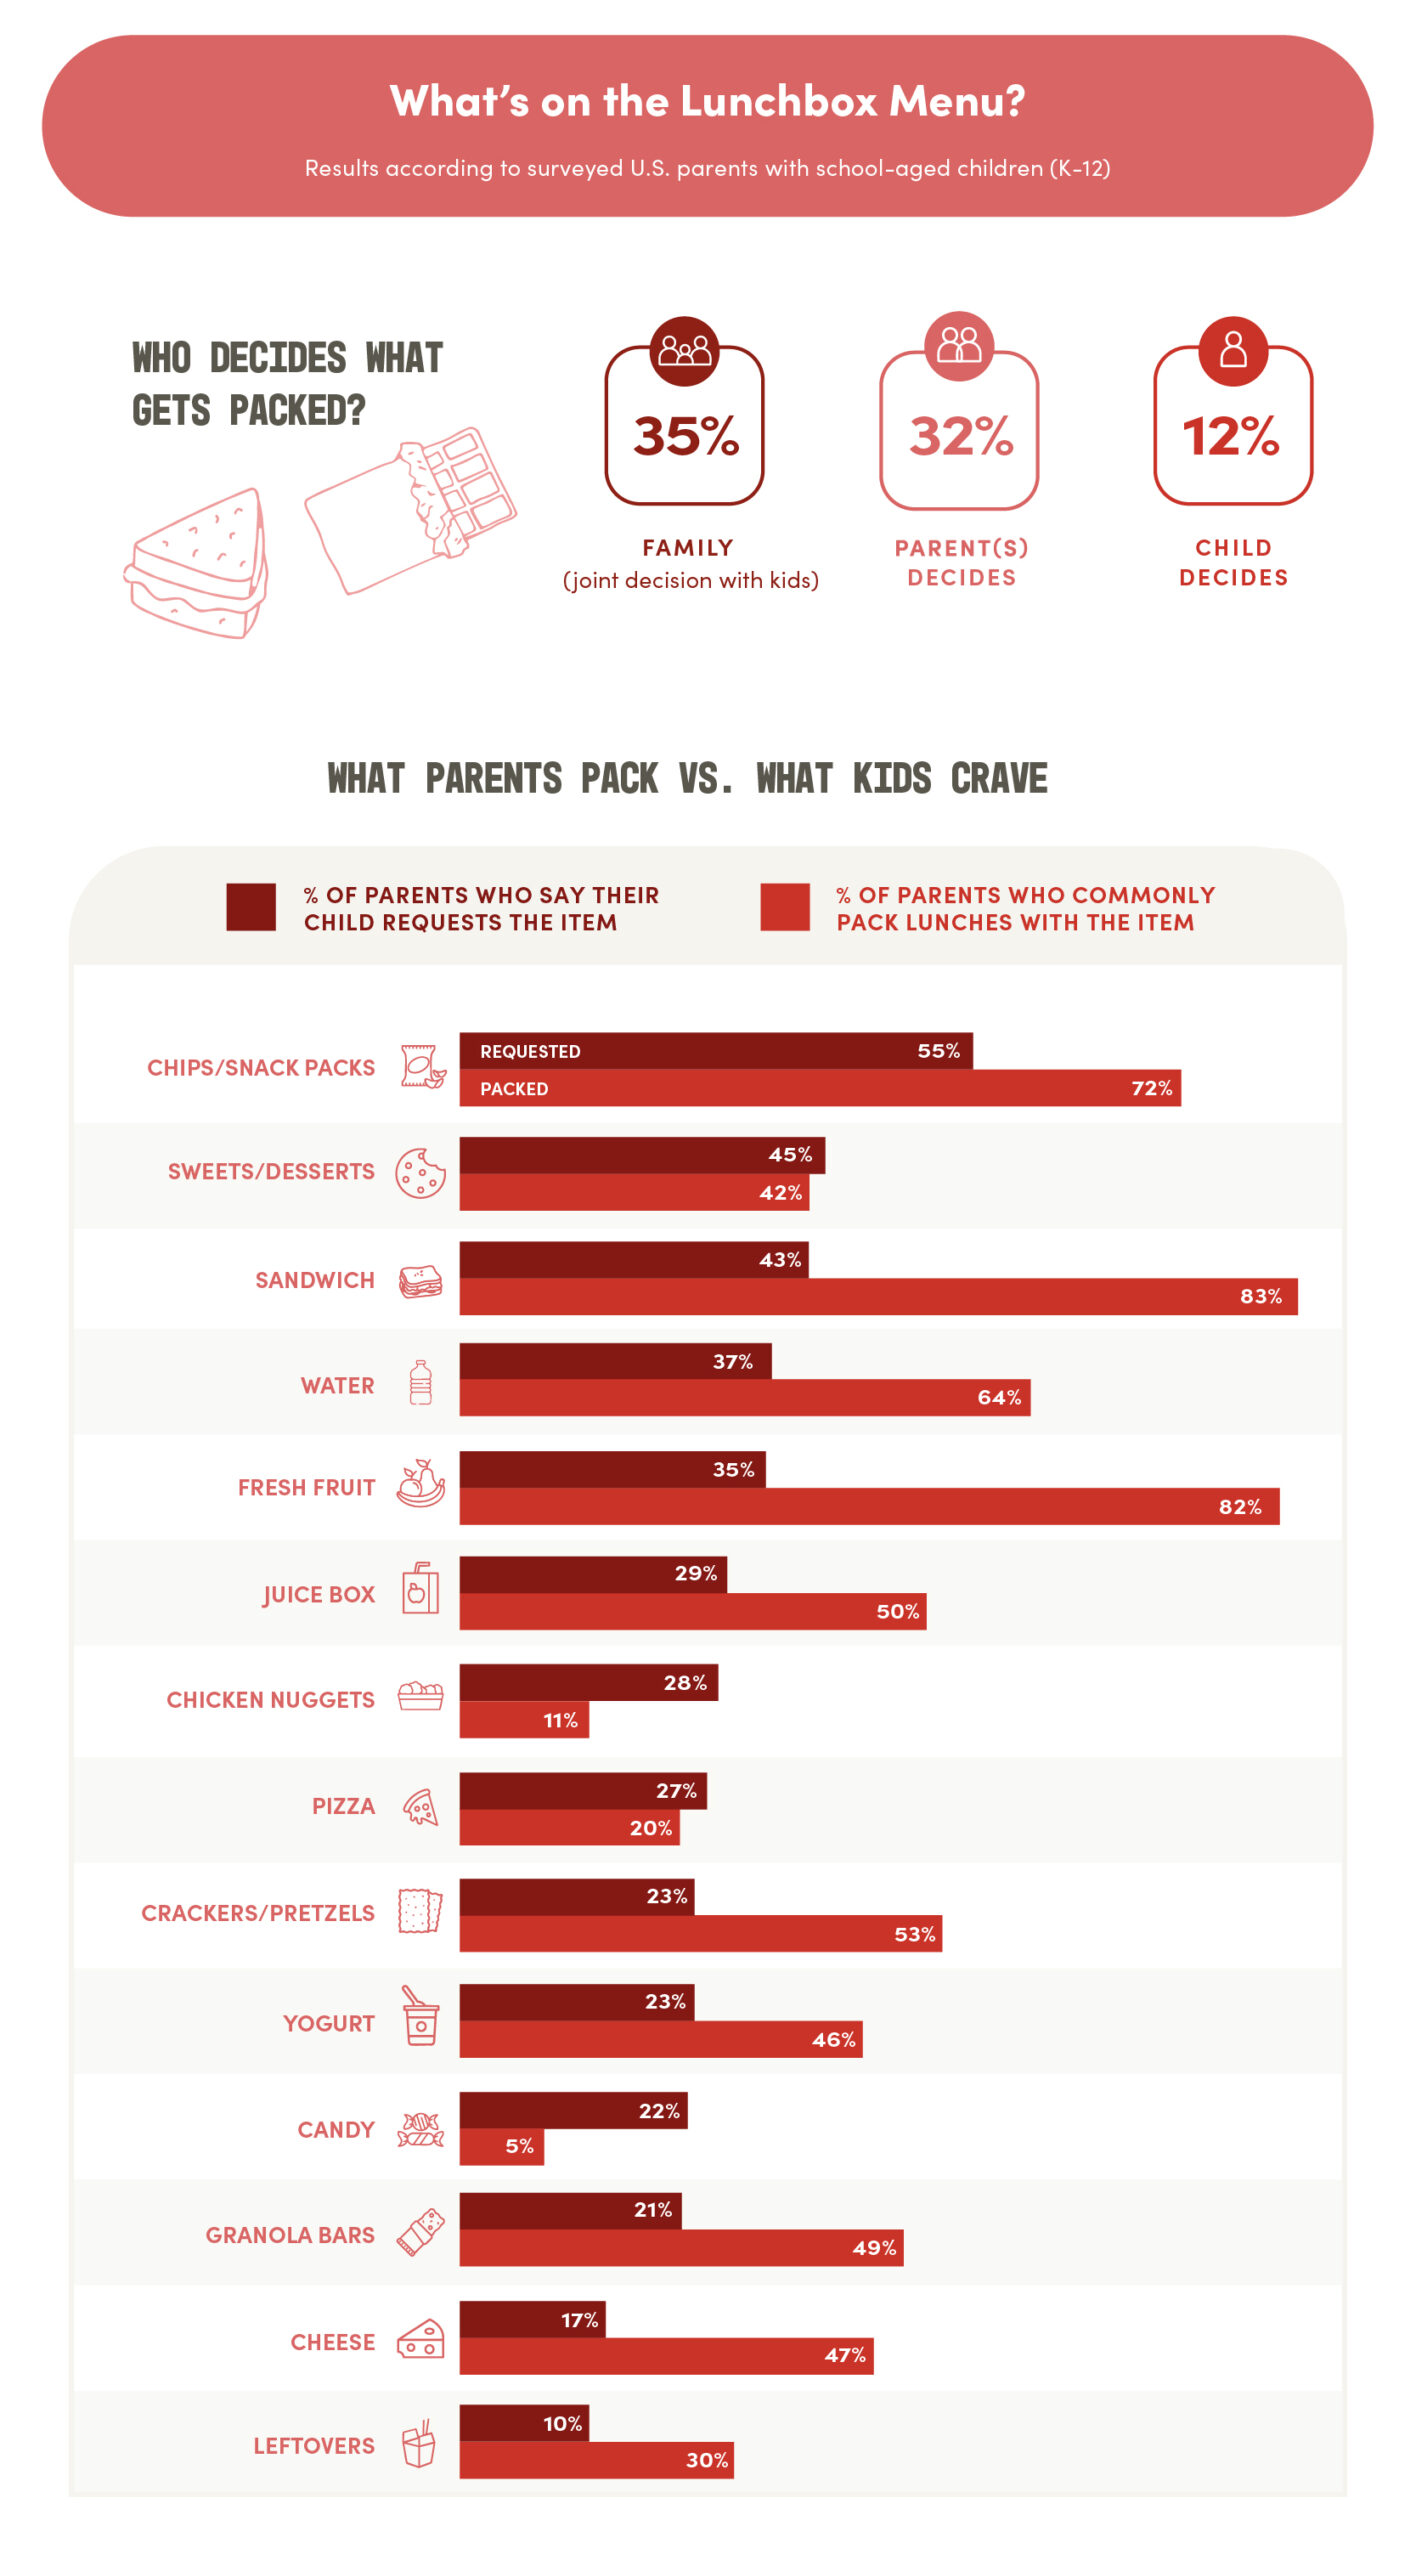
On average, parents spend nearly 54 minutes per week putting together their child’s lunch, with most preparing meals three days per week. Who calls the shots on what goes inside, though? In most households, it’s either a family effort (35%) or up to the parent alone (32%). Just 12% of kids run the lunchbox menu, according to respondents.
When it comes to what actually gets packed, sandwiches, fruit, and snack packs reign supreme. Unsurprisingly, that reality clashes with kids’ preferences, with chips, cookies, chicken nuggets, and pizza topping their wish lists.
Pizza in School Lunches: What Parents Really Think
When it comes to school lunches, few foods spark as much excitement, or debate, as pizza.
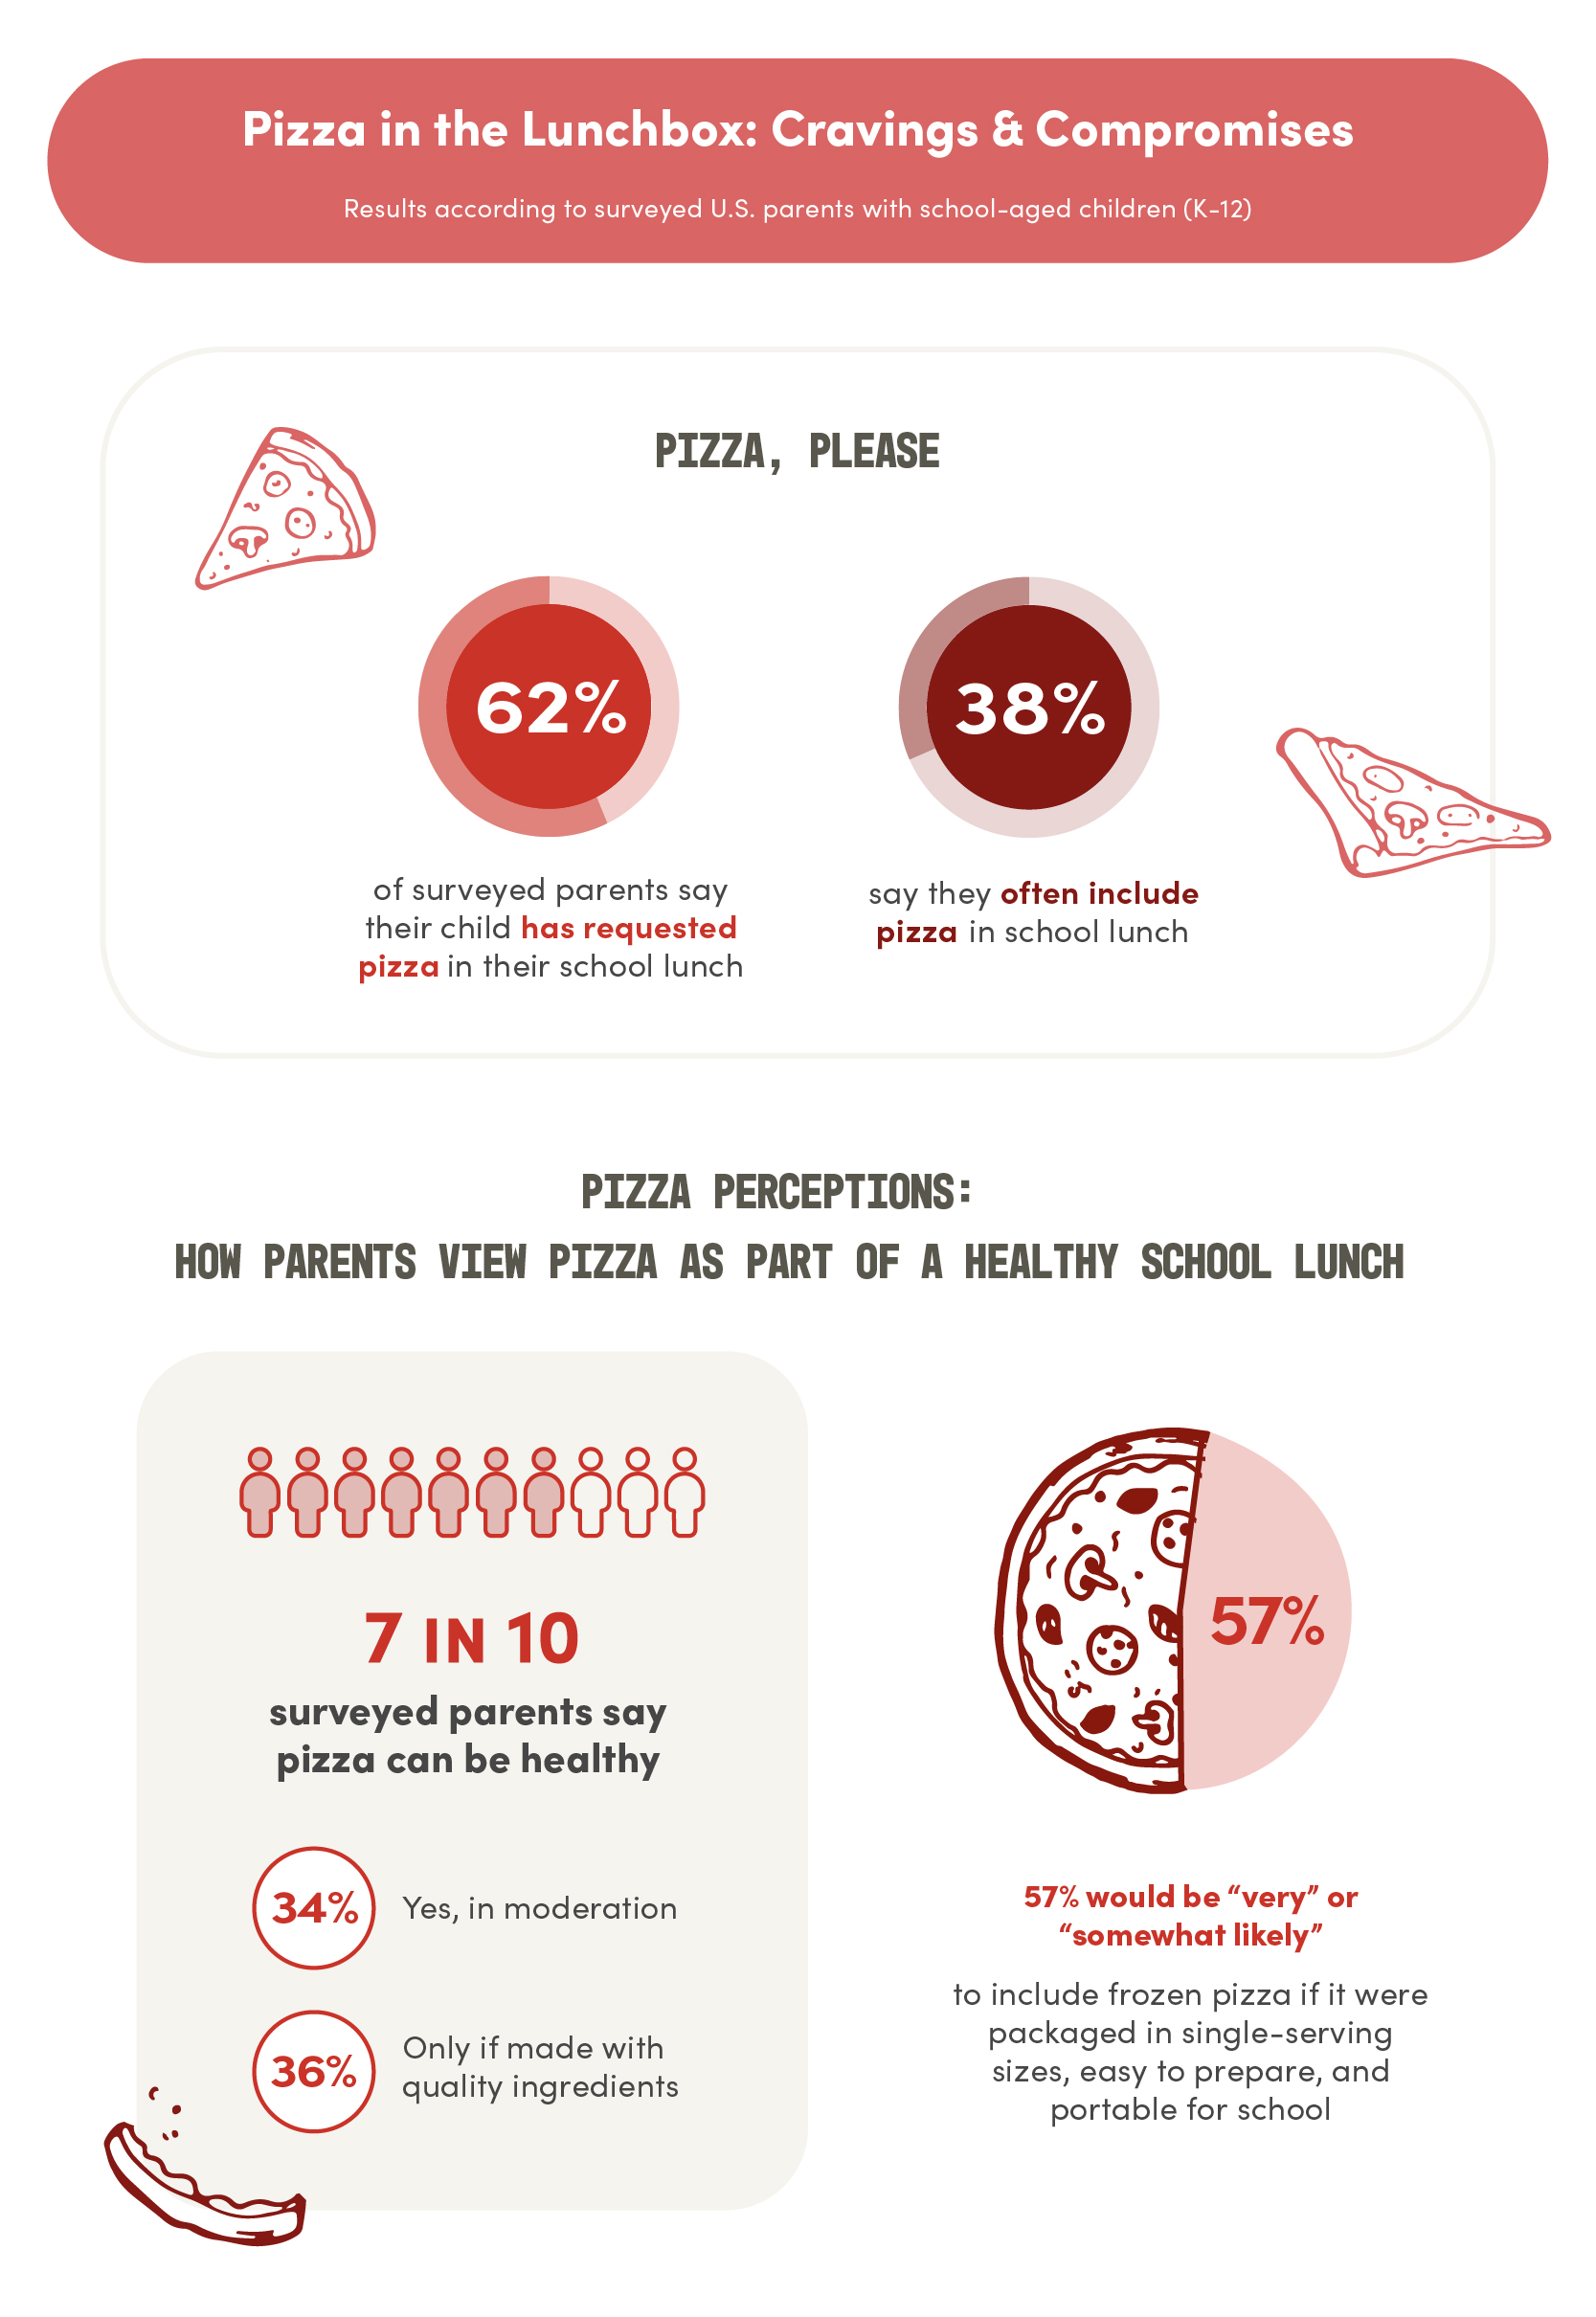
According to parents, pizza isn’t just a Friday treat anymore: 62% say their child has requested it for lunch, and more than 1 in 3 (38%) say they often include it in their child’s school lunch routine.
But what about nutrition? Turns out, 7 in 10 parents believe pizza can be part of a healthy lunch when approached thoughtfully. One-third (34%) say yes to pizza in moderation, and 36% say yes only if it’s made with quality (e.g., fresh or nutritious) ingredients.
A majority of parents expressed interest in a version of pizza designed specifically for school, with 57% agreeing they’d be likely to include a portable, portioned, and ready-to-pack pizza in their child’s lunchbox.
Lunch Packing Stress: Picky Eaters and Burnout Statistics
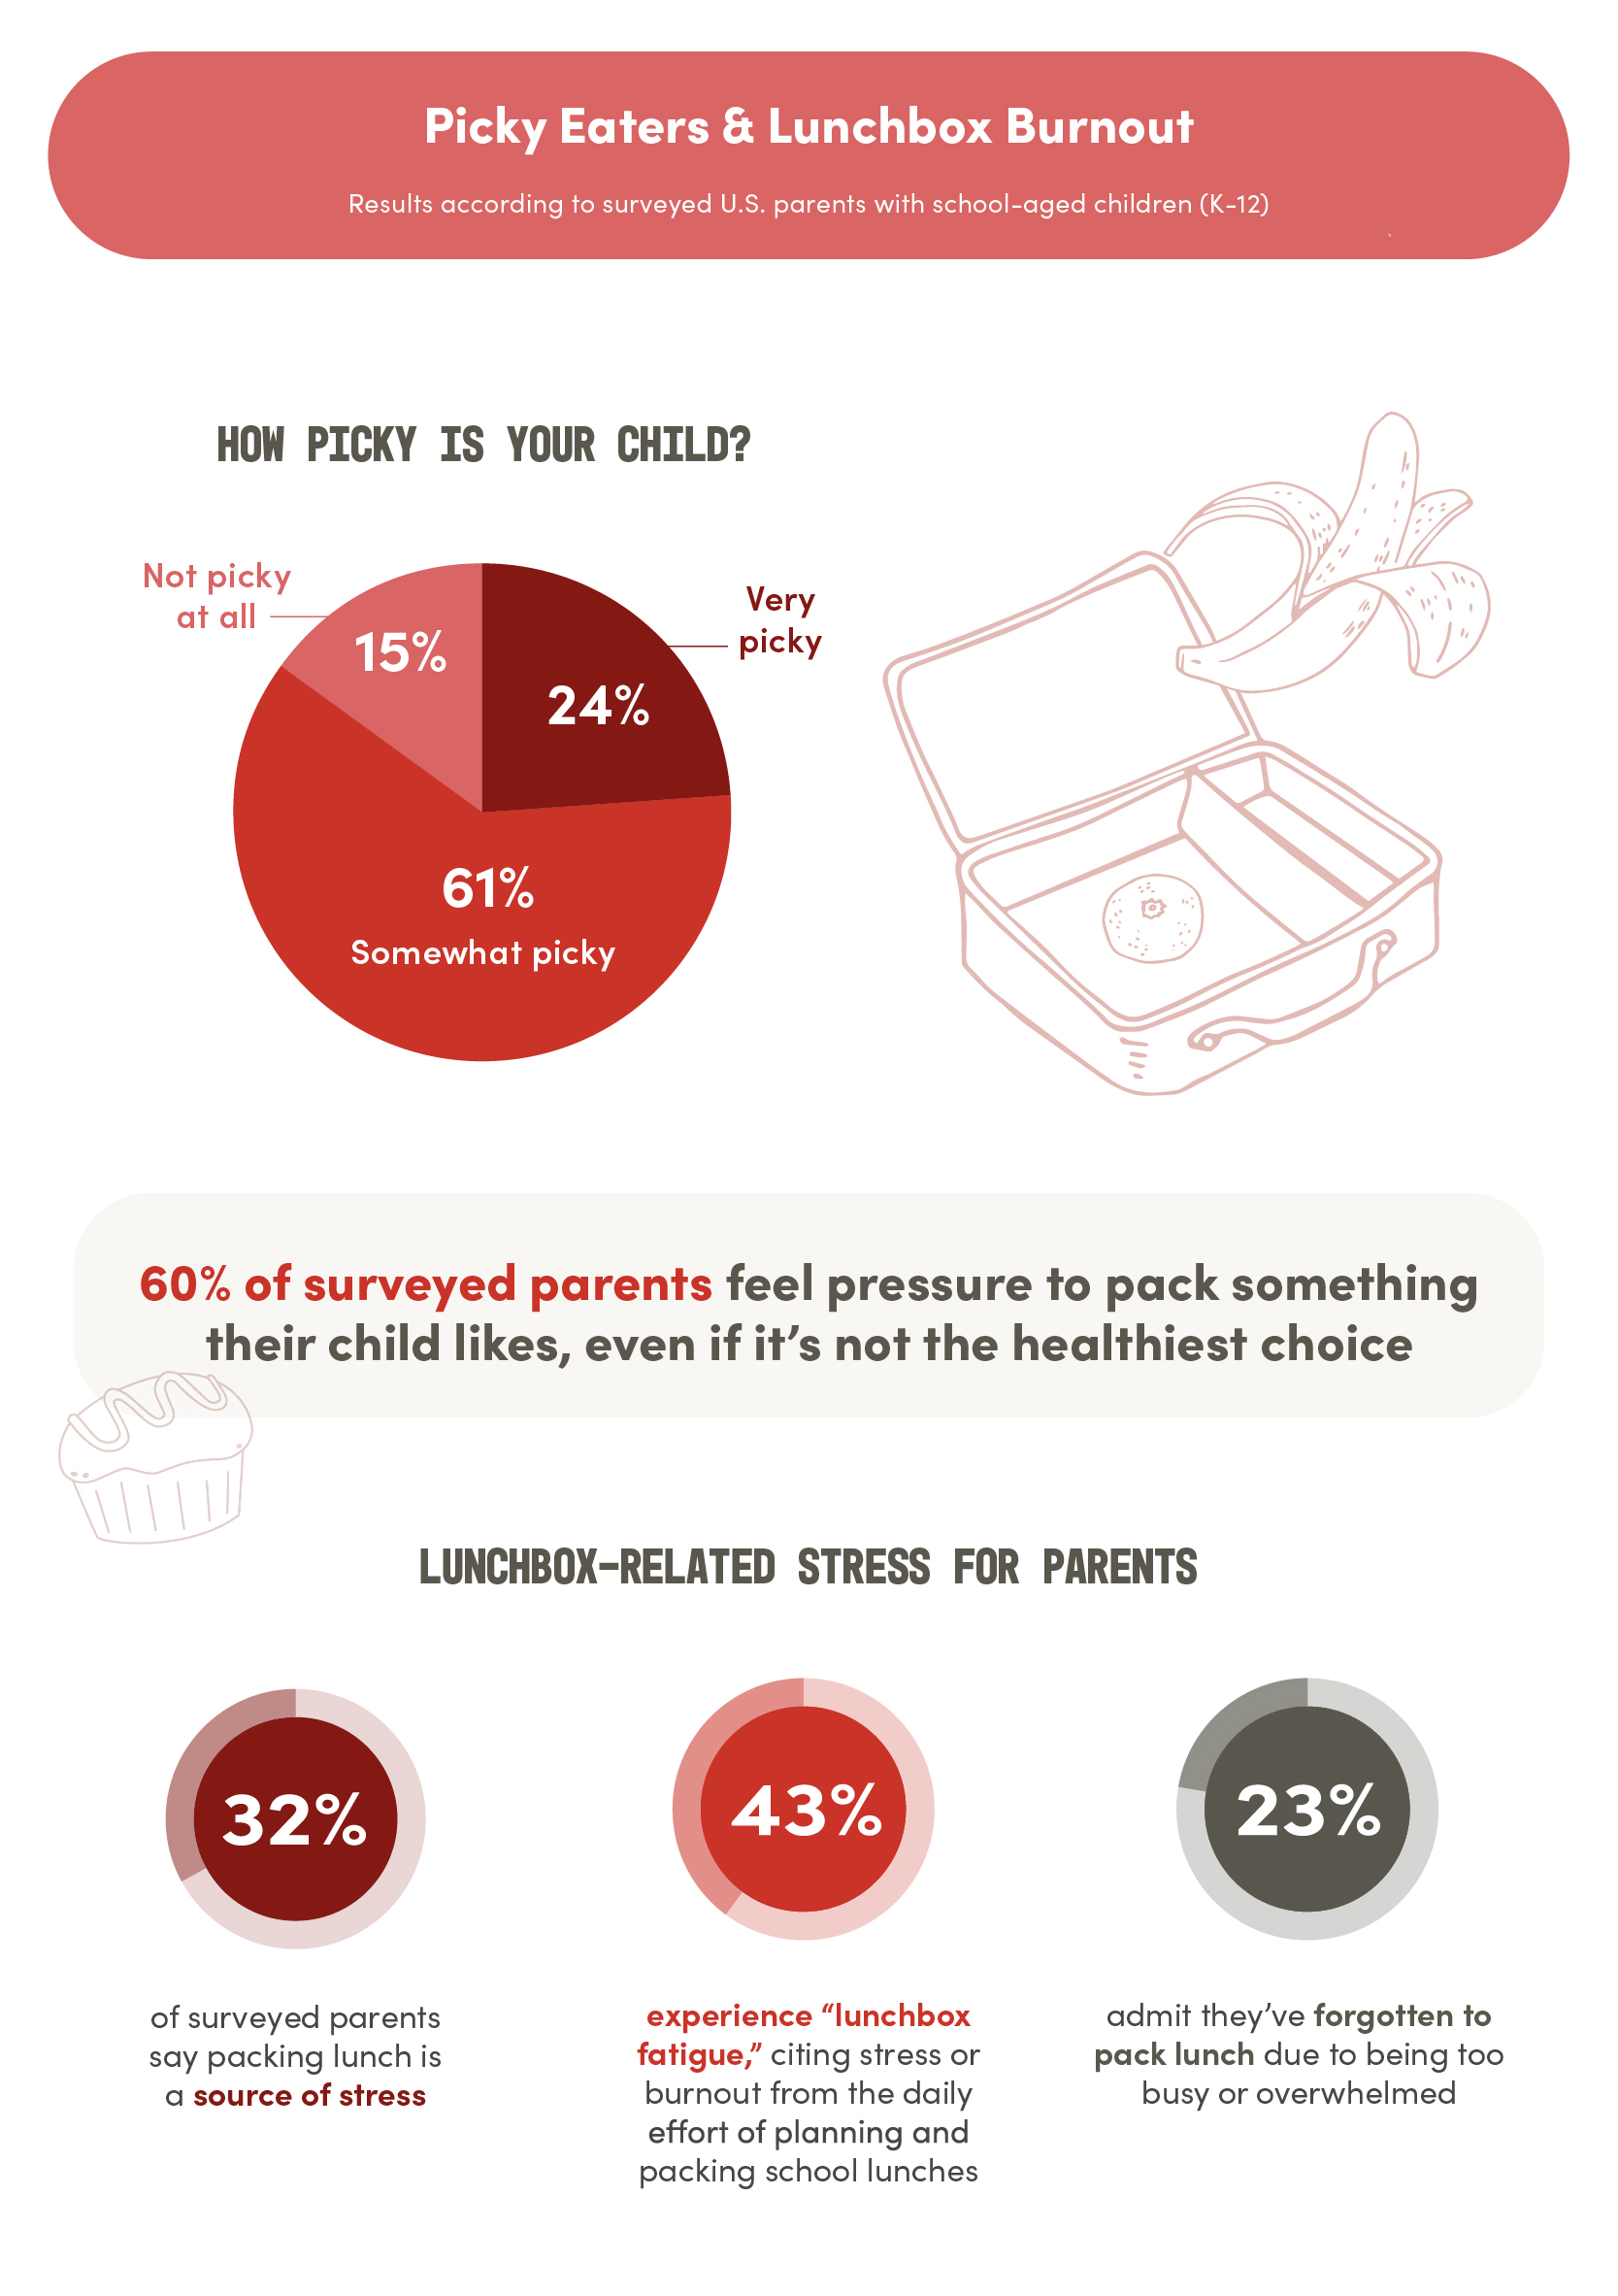
If school lunches feel like a battle, you’re not alone. More than 8 in 10 surveyed parents say their child is at least “somewhat picky” when it comes to what goes in the lunchbox, with 1 in 4 (24%) calling their child “very picky.”
This finicky feedback often leads to a feeling many parents know all too well: lunchbox burnout. According to respondents, 43% say they feel fatigue or burnout from packing lunches, while 32% say packing lunch is a source of stress.
And nearly 1 in 4 (23%) admit they’ve forgotten to pack a lunch because they were simply too overwhelmed.
Balancing nutrition, taste, and time constraints has made school lunch prep one of the most unexpectedly stressful tasks of the school year.
How Much Parents Spend on School Lunch
It’s no secret that feeding kids has gotten more expensive, and school lunches are no exception.
Surveyed parents estimate they spend about $715 per year on school lunches. But many families don’t realize just how much they’re spending. Nearly two-thirds of parents (65%) underestimate their annual school lunch costs. On average, they’re off by nearly $300 per year!
With rising food prices, more than 1 in 4 respondents (26%) say they’ll need to cut back this school year. Top cost-saving strategies include buying in bulk (45%), using leftovers more often (24%), and buying cheaper ingredients (24%).
Are School Lunches Nutritious? Here’s What Parents Say
For some families, school lunch is a time-saver. For others, it’s a nutritional compromise.
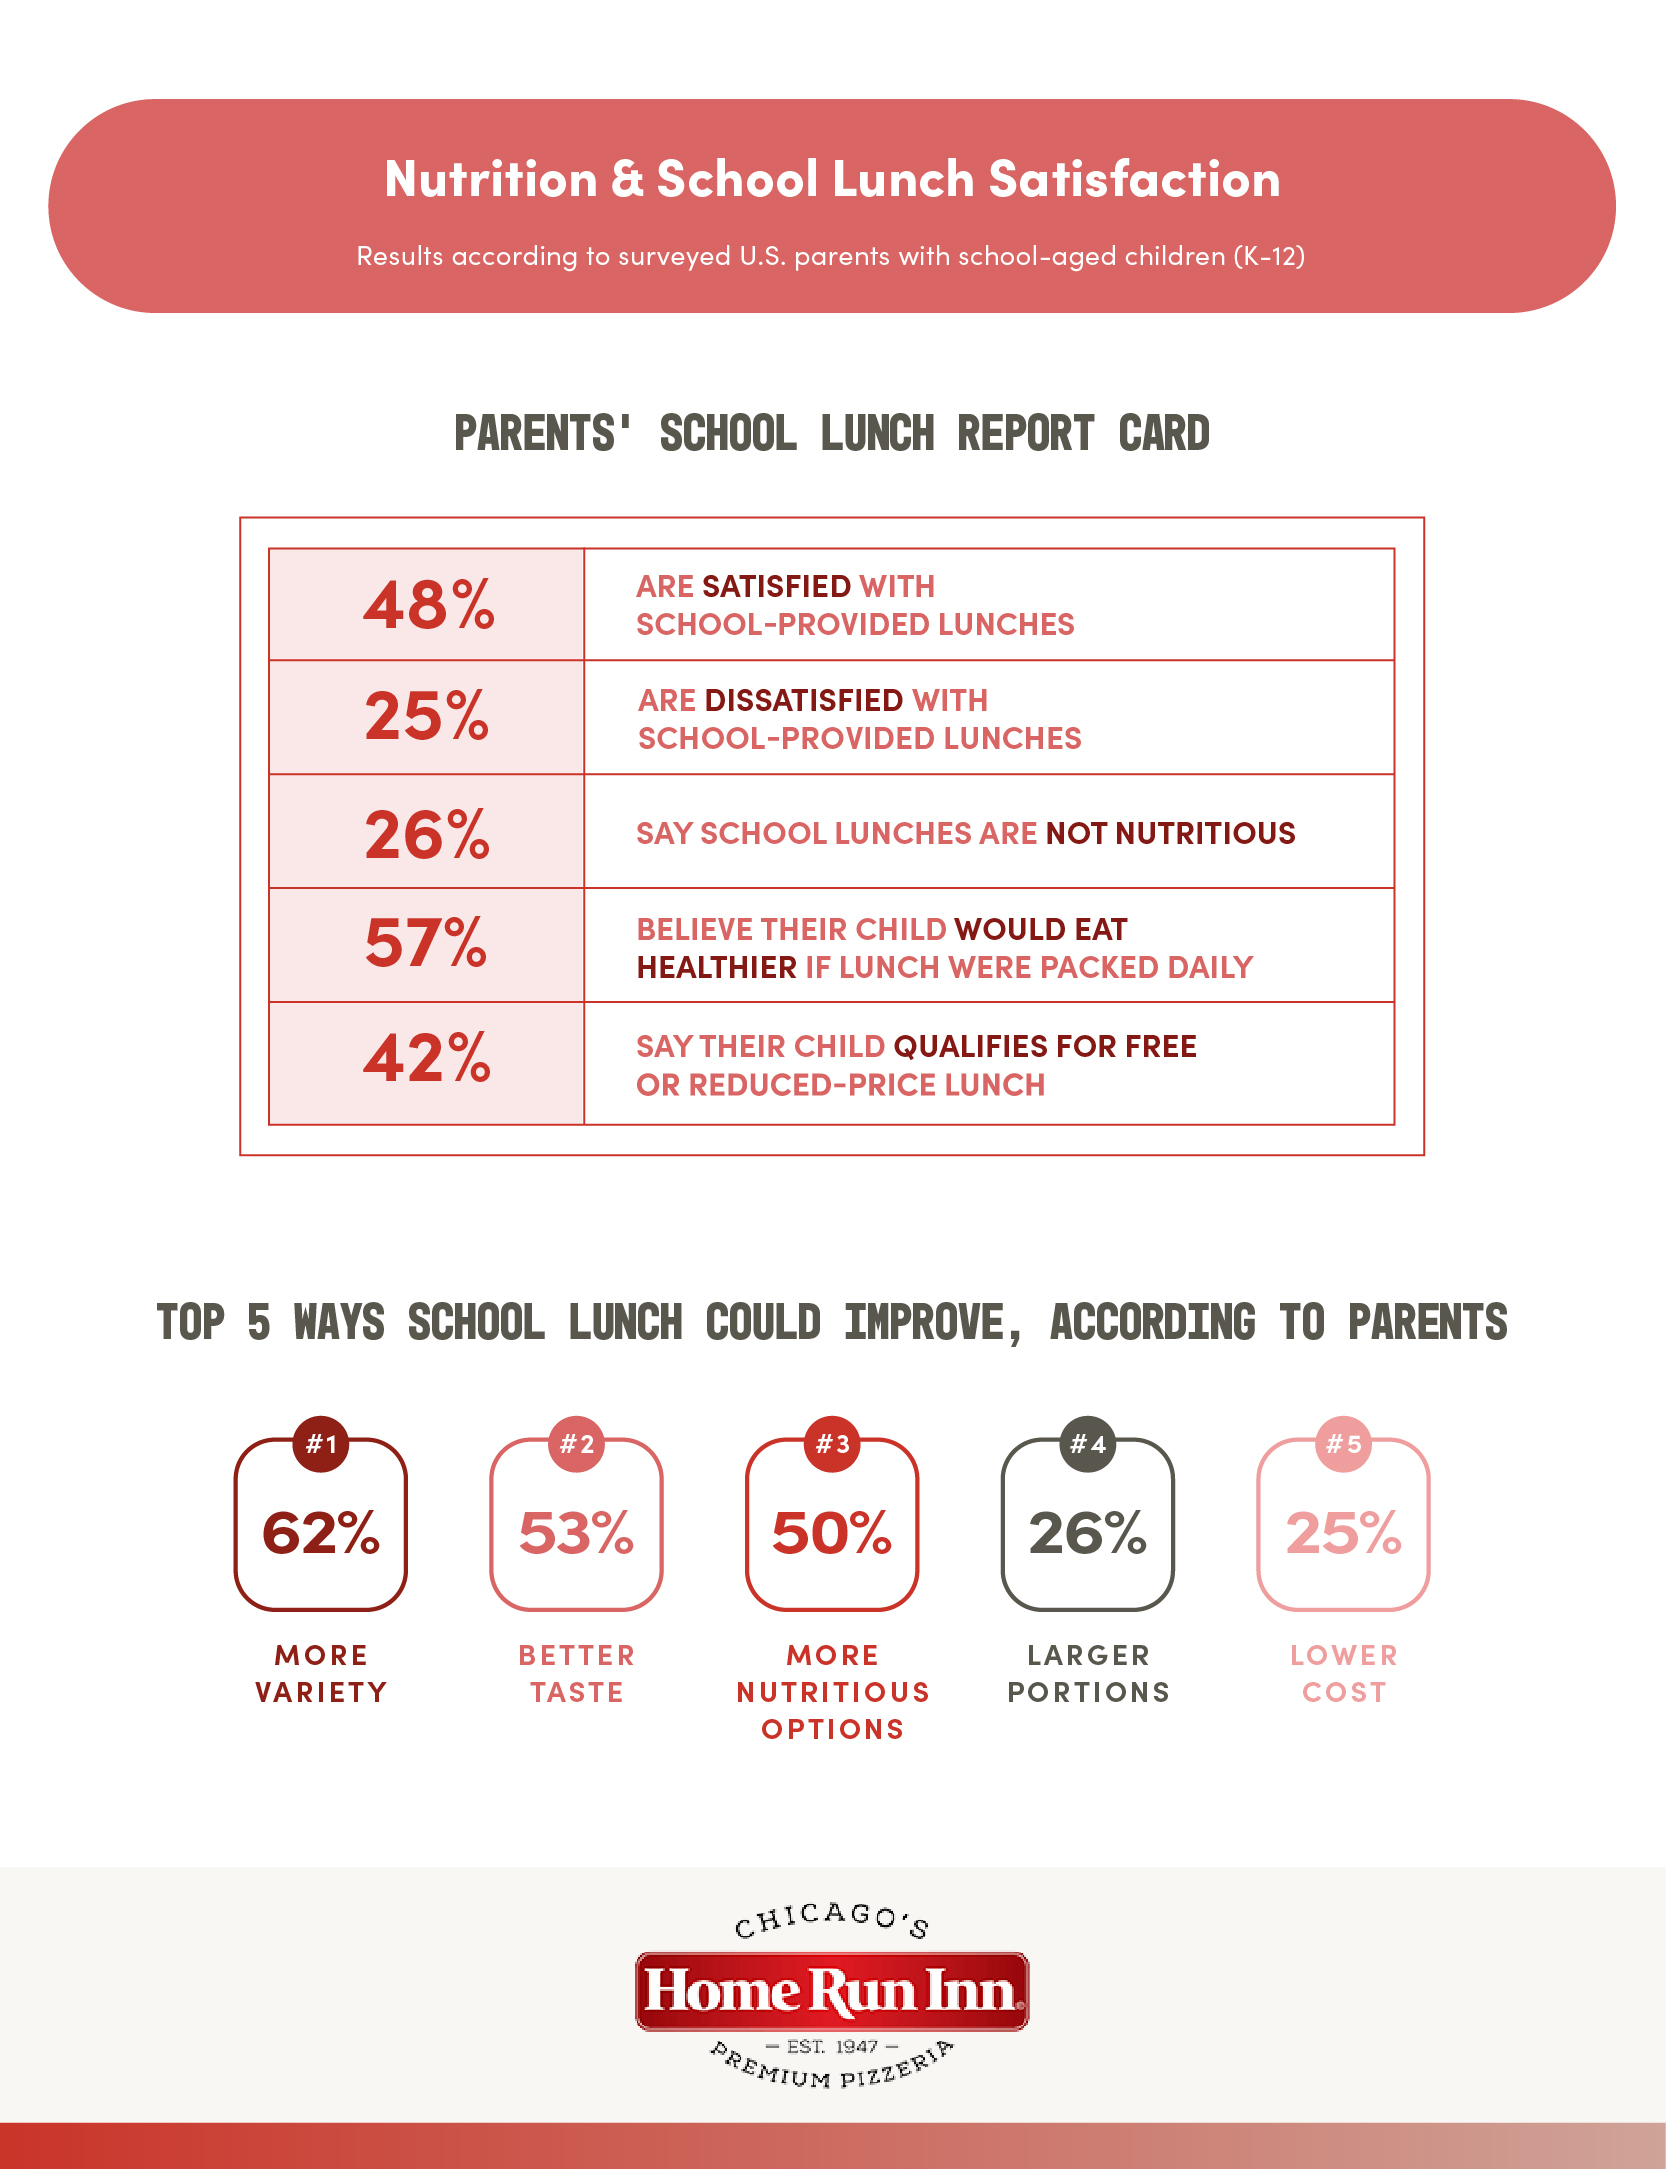
Less than half of surveyed parents (48%) are satisfied with the quality of school-provided lunches, while 1 in 4 (25%) are dissatisfied. A significant portion (26%) say school lunches aren’t nutritious, and 57% believe their child would eat healthier if lunch were packed from home daily.
Nutrition isn’t always the deciding factor though, as many parents occasionally cater to their child’s preferences. In fact, 60% of parents say they feel pressure to pack something their child likes, even if it’s not the healthiest option. For many, it’s about finding a balance between what’s practical, what’s affordable, and what their kids will agree to eat.
From nutrition concerns and budget pressures to pizza pleas and picky eaters, today’s school lunch experience is shaped by a mix of priorities.
Methodology
In August 2025, we conducted a nationwide survey of 1,500 parents and legal guardians.
This survey explored the state of school lunches from the parent perspective, including lunch packing habits, budget considerations, nutrition concerns, and children’s preferences. Respondents were asked about their typical lunch routines, who decides what goes into lunchboxes, perceived cost and nutritional value of school lunches, and the emotional impact of daily lunch prep.
The survey was conducted among 1,500 U.S. adults who are the parent or legal guardian of a child currently attending K–12 school during the 2025 academic year. Results reflect a nationwide sample and have been rounded for clarity.
Gender: Female (61%), Male (37%), Non-binary (2%)
Average age: 41
Income Levels: Under $25,000 (8%), $25,000–$34,999 (8%), $35,000–$49,999 (12%), $50,000–$74,999 (22%), $75,000–$99,999 (17%), $100,000–$149,999 (20%), Over $150,000 (13%)
Marital Status: Married (61%), Single (16%), In a Relationship/Not Married (12%), Divorced (8%), Separated (2%), Widowed (1%)
Total respondents: 1,500
Margin of error: +/- 3%
Country: United States (USA)
Region: All Regions
Gender: All Genders